
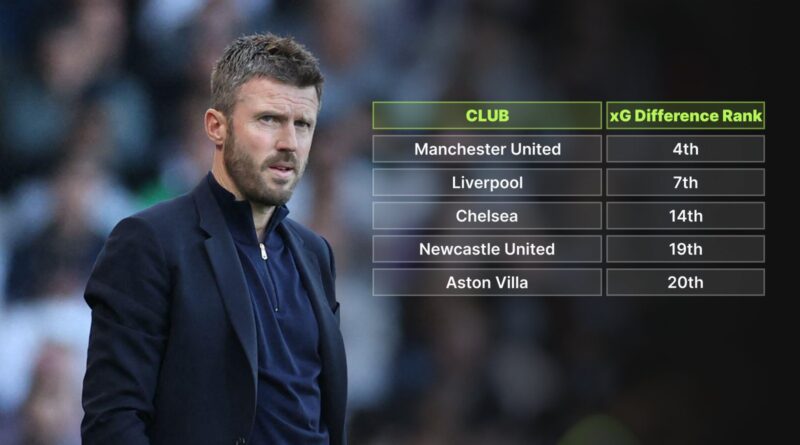
Man Utd FOURTH in Premier League xG table while Villa, Newcastle dismal
It’s still early days in the 2026-27 Premier League season, and we’re only just reaching the first international break, with the table still taking shape. But what do the underlying statistics tell us? Which teams are playing better than their results might suggest, and which teams are overperforming?
That’s where good old ‘expected goals’, rattler of Proper Football Men across the country, helps us out. We’ve delved into the data to see which teams are doing best and worst in terms of the quality of chances they’ve created and faced.
After their three-goal showing against Arsenal at the weekend, Brighton & Hove Albion are the division’s top-scoring team – and that’s borne out by their underlying numbers, having created 11.5xG, comfortably the highest total in the division.
The Seagulls are overperforming their underlying xG numbers more than any other team, but creating bagloads of chances and being clinical with them is a pretty deadly combination.
Elsewhere, under-pressure Michael Carrick might be heartened to learn that Manchester United rank fourth in the Premier League for xG, while Manchester City, Arsenal, Liverpool and Chelsea are all unsurprisingly in the top half. Brentford, Leeds and newly-promoted Ipswich Town are doing alright on that front too.
At the other end, you won’t be at all shocked to learn that Arsenal have comfortably the best xG against numbers in the Premier League. The reigning champions have earned their reputation as the best defensive side in the country, which is underlined by conceding just 4.0xG against them this season – which tallies exactly against how many goals they’ve shipped in reality.
Manchester City rank second for xG difference, although their defensive numbers took a bit of a battering in that bonkers 5-3 victory over Sunderland, in which they conceded a club record 4.61xG. Even so, their healthy numbers at both ends suggest they’re right in the mix alongside Arsenal.
Brentford, Nottingham Forest, Manchester United, Brighton, Liverpool, Leeds and Sunderland are also registering decent output when it comes to their underlying expected goals numbers.
Taking a look at the picture as a whole, Carrick’s Manchester United are still among the biggest xG underperformers at this fledgling stage of the campaign. They rank fourth for expected goal difference and are level on eight expected points with a cluster of sides behind Arsenal, Manchester City and Forest.
If you put your faith in this data and trust that underlying numbers will eventually be reflected in results, the Red Devils will be just fine. On the other hand, if they continue to underperform on both fronts for a sustained period of time, that might suggest a more chronic issue with their finishing and goalkeeper.
On the inverse, Tottenham might expect to be doing marginally better than their results suggest – although the picture still isn’t great, with Spurs sitting 14th for xG and 11th for xG against.
The underlying numbers are probably most concerning for Aston Villa and Newcastle United, who sit bottom for xG difference and expected points respectively.
Here are all the relevant 2026-27 Premier League tables for xG so far, with the data taken from FotMob.
xG (Expected Goals)
1. Brighton & Hove Albion — 11.5 (+4.5)
2. Manchester City — 10.5 (+2.5)
3. Brentford — 9.9 (+0.1)
4. Manchester United — 9.9 (-1.9)
5. Sunderland — 9.8 (-3.8)
6. Arsenal — 8.5 (-0.5)
7. Liverpool — 8.3 (-1.3)
8. Leeds United — 7.7 (-0.7)
9. Ipswich Town — 7.7 (-0.7)
10. Fulham — 7.7 (-2.7)
11. Nottingham Forest — 7.3 (-3.3)
12. Everton — 7.3 (-1.3)
13. Chelsea — 7.3 (+2.7)
14. AFC Bournemouth — 6.7 (-0.7)
15. Crystal Palace — 6.3 (-0.3)
16. Tottenham Hotspur — 5.0 (-3.0)
17. Newcastle United — 5.3 (+3.7)
18. Hull City — 5.3 (+0.7)
19. Coventry City — 4.9 (-3.9)
20. Aston Villa — 4.5 (-0.5)
xGA (Expected Goals Against)
1. Arsenal — 4.0 (=)
2. Nottingham Forest — 4.8 (+0.2)
3. Liverpool — 6.1 (-2.1)
4. Brentford — 6.3 (-2.3)
5. Leeds United — 6.5 (-3.5)
6. Manchester United — 6.8 (+1.2)
7. Everton — 6.9 (-3.9)
8. AFC Bournemouth — 6.9 (+1.1)
9. Manchester City — 7.2 (-2.2)
10. Hull City — 7.4 (-3.4)
11. Tottenham Hotspur — 7.8 (+0.2)
12. Sunderland — 8.6 (+1.4)
13. Coventry City — 8.6 (+1.4)
14. Brighton & Hove Albion — 8.7 (-3.7)
15. Chelsea — 8.8 (+3.2)
16. Ipswich Town — 9.0 (+2.0)
17. Fulham — 9.1 (-1.1)
18. Newcastle United — 9.1 (-0.1)
19. Aston Villa — 9.2 (-0.2)
20. Crystal Palace — 9.5 (+1.5)
xG Difference (xG – xGA)
1. Arsenal — 4.5
2. Brentford — 3.6
3. Manchester City — 3.3
4. Manchester United — 3.1
5. Brighton & Hove Albion — 2.8
6. Nottingham Forest — 2.5
7. Liverpool — 2.2
8. Sunderland — 1.2
9. Leeds United — 1.2
10. Everton — 0.4
11. AFC Bournemouth — -0.2
12. Ipswich Town — -1.3
13. Fulham — -1.4
14. Chelsea — -1.5
15. Hull City — -2.1
16. Tottenham Hotspur — -2.8
17. Crystal Palace — -3.2
18. Coventry City — -3.7
19. Newcastle United — -3.8
20. Aston Villa — -4.7
xPTS (Expected Points)
1. Arsenal — 10 (+2)
2. Manchester City — 9 (+6)
3. Nottingham Forest — 9 (-4)
4. Brentford — 8 (+1)
5. Manchester United — 8 (-3)
6. Liverpool — 8 (+1)
7. Brighton & Hove Albion — 8 (+2)
8. Sunderland — 8 (-4)
9. Leeds United — 8 (+1)
10. Everton — 7 (+2)
11. AFC Bournemouth — 7 (-4)
12. Ipswich Town — 7 (-1)
13. Chelsea — 6 (+1)
14. Tottenham Hotspur — 6 (-4)
15. Fulham — 6 (-4)
16. Hull City — 5 (+3)
17. Crystal Palace — 5 (-1)
18. Aston Villa — 5 (-1)
19. Coventry City — 4 (-1)
20. Newcastle United — 4 (+4)
READ NEXT: The wild Premier League table of 2026: Man Utd 3rd, Leeds 6th, Spurs 18th…
TRY A QUIZ: Can you name the 17 players who are their nation’s only Premier League representative?